 Contact
 Help
Help





Gold Silver Ratio: A Complete Guide
 Gold & Silver 101



The gold silver ratio (GSR) is a metric that compares the value of gold to silver, specifically, how many ounces of silver it takes to buy one ounce of gold. Currently sitting at around 67, it’s one of the most widely tracked measures in precious metals investing, and is used by some investors as a guide on which metal offers better value.
In this guide we take a look at the gold silver ratio: how to calculate it, what it means historically, and how some investors use it to inform their buying decisions.
What Is the Gold Silver Ratio?
The gold silver ratio is simply the gold price divided by the silver price. Because precious metal prices fluctuate constantly, so too does the ratio – it updates throughout every trading day. Below is the gold silver ratio formula.
GSR = Gold Price / Silver Price
For example, if gold is priced at US$4,000 per ounce and silver at US$40 per ounce, the gold silver ratio is 100. Put another way, it would take 100 ounces of silver to buy 1 ounce of gold.
What Does Gold Silver Ratio Mean?
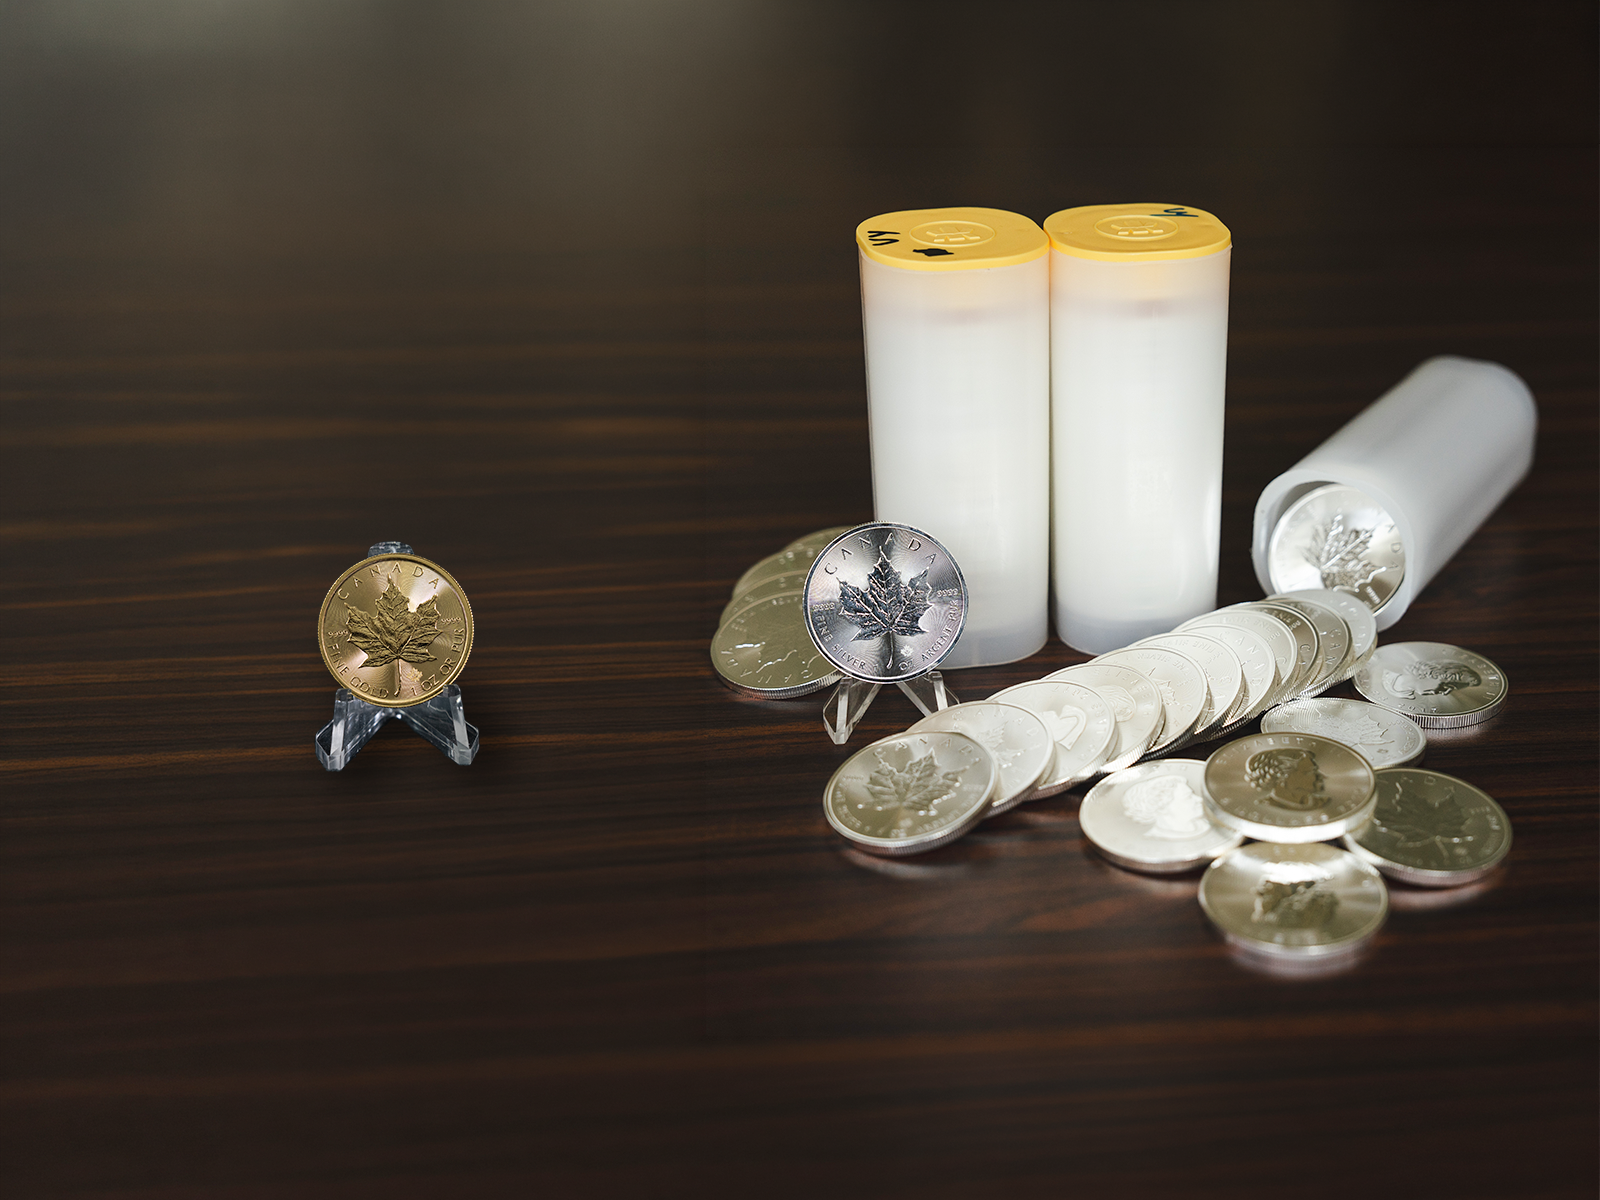
The gold silver ratio tells you how the two metals are valued relative to each other. A high ratio, say, 80 or above, means gold is expensive compared to silver, which some investors interpret as silver being undervalued. A low ratio suggests the opposite: silver has gained ground on gold.
For some, the ratio is simply a historical curiosity; for others it’s a practical signal for deciding which metal to buy at any given time.
The Current Gold Silver Ratio
BullionStar’s live gold silver ratio chart updates in real time, and can be used to track how the ratio is moving over any timeframe.
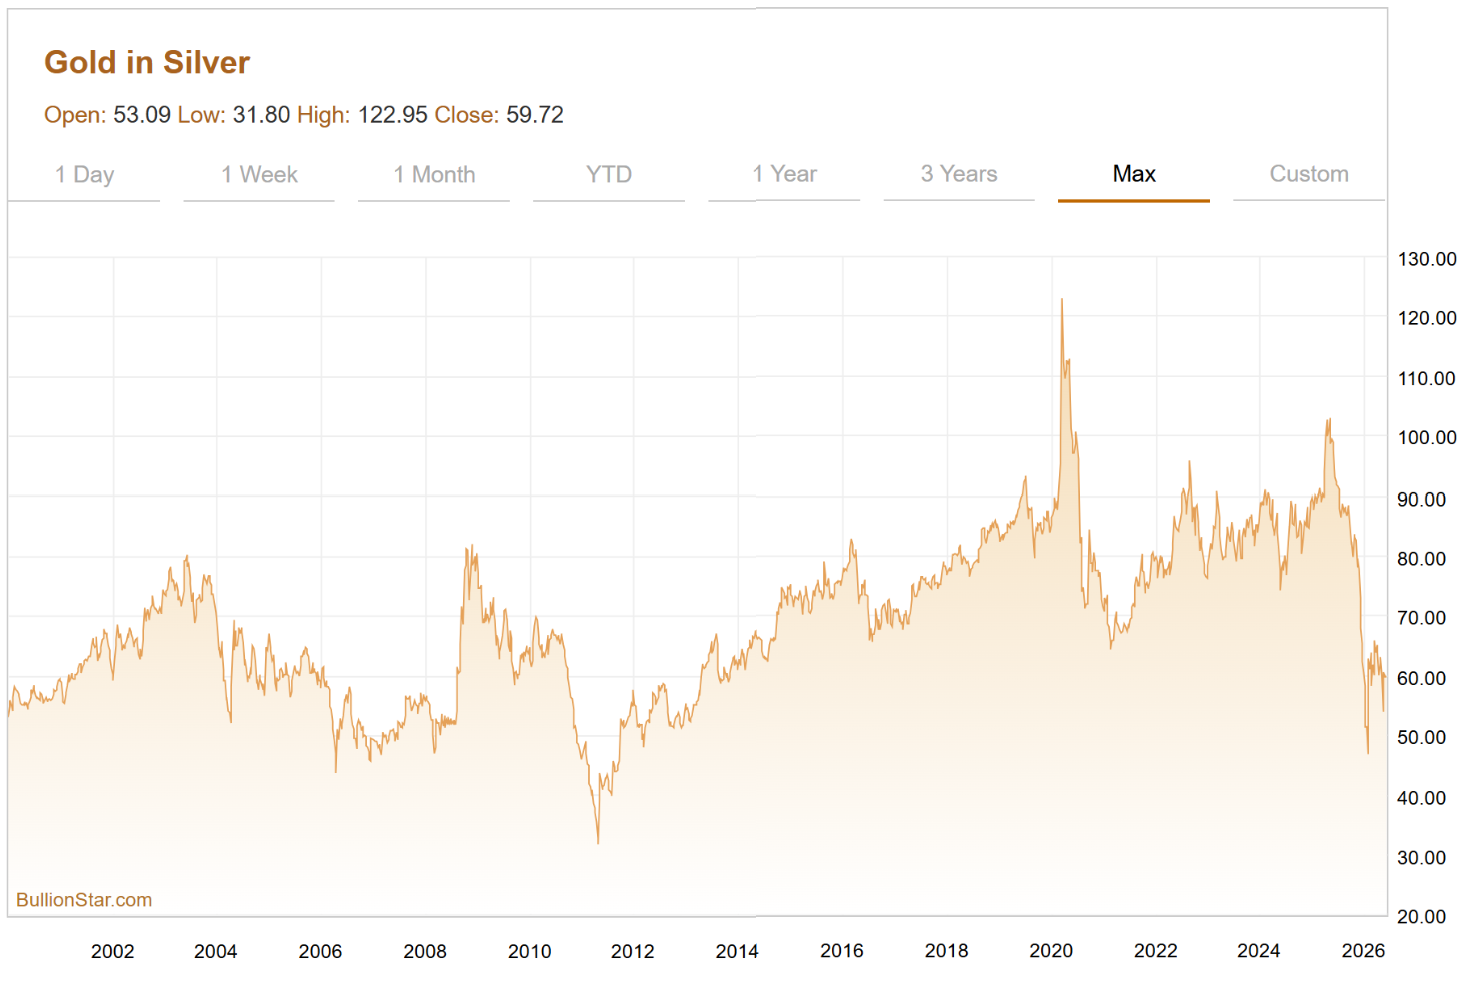
At the time of writing, the gold silver ratio sits at around 67, just below the 10-year average of roughly 70. Keeping an eye on the current ratio can be useful for anyone thinking about buying gold or silver, or looking to rebalance their holdings between the two metals. Unlike individual spot prices, which can swing sharply on any given day, the ratio tends to move more gradually, making it a useful tool for gauging broader trends.
Silver to Gold Ratio
The silver to gold ratio is simply the inverse of the GSR. Using the same example – gold at US$4,000 and silver at US$40 – the silver to gold ratio would be 0.01 (40/4,000). While it expresses the same relationship, the gold silver ratio is the widely accepted convention, since gold is the benchmark asset in precious metals markets.
Historical Gold Silver Ratio
The historical gold silver ratio offers a fascinating insight into how the two metals were valued, particularly when both served as monetary metals. For centuries, some of history’s greatest civilisations operated on a gold standard, silver standard, or a combination of the two (known as a bimetallic standard).
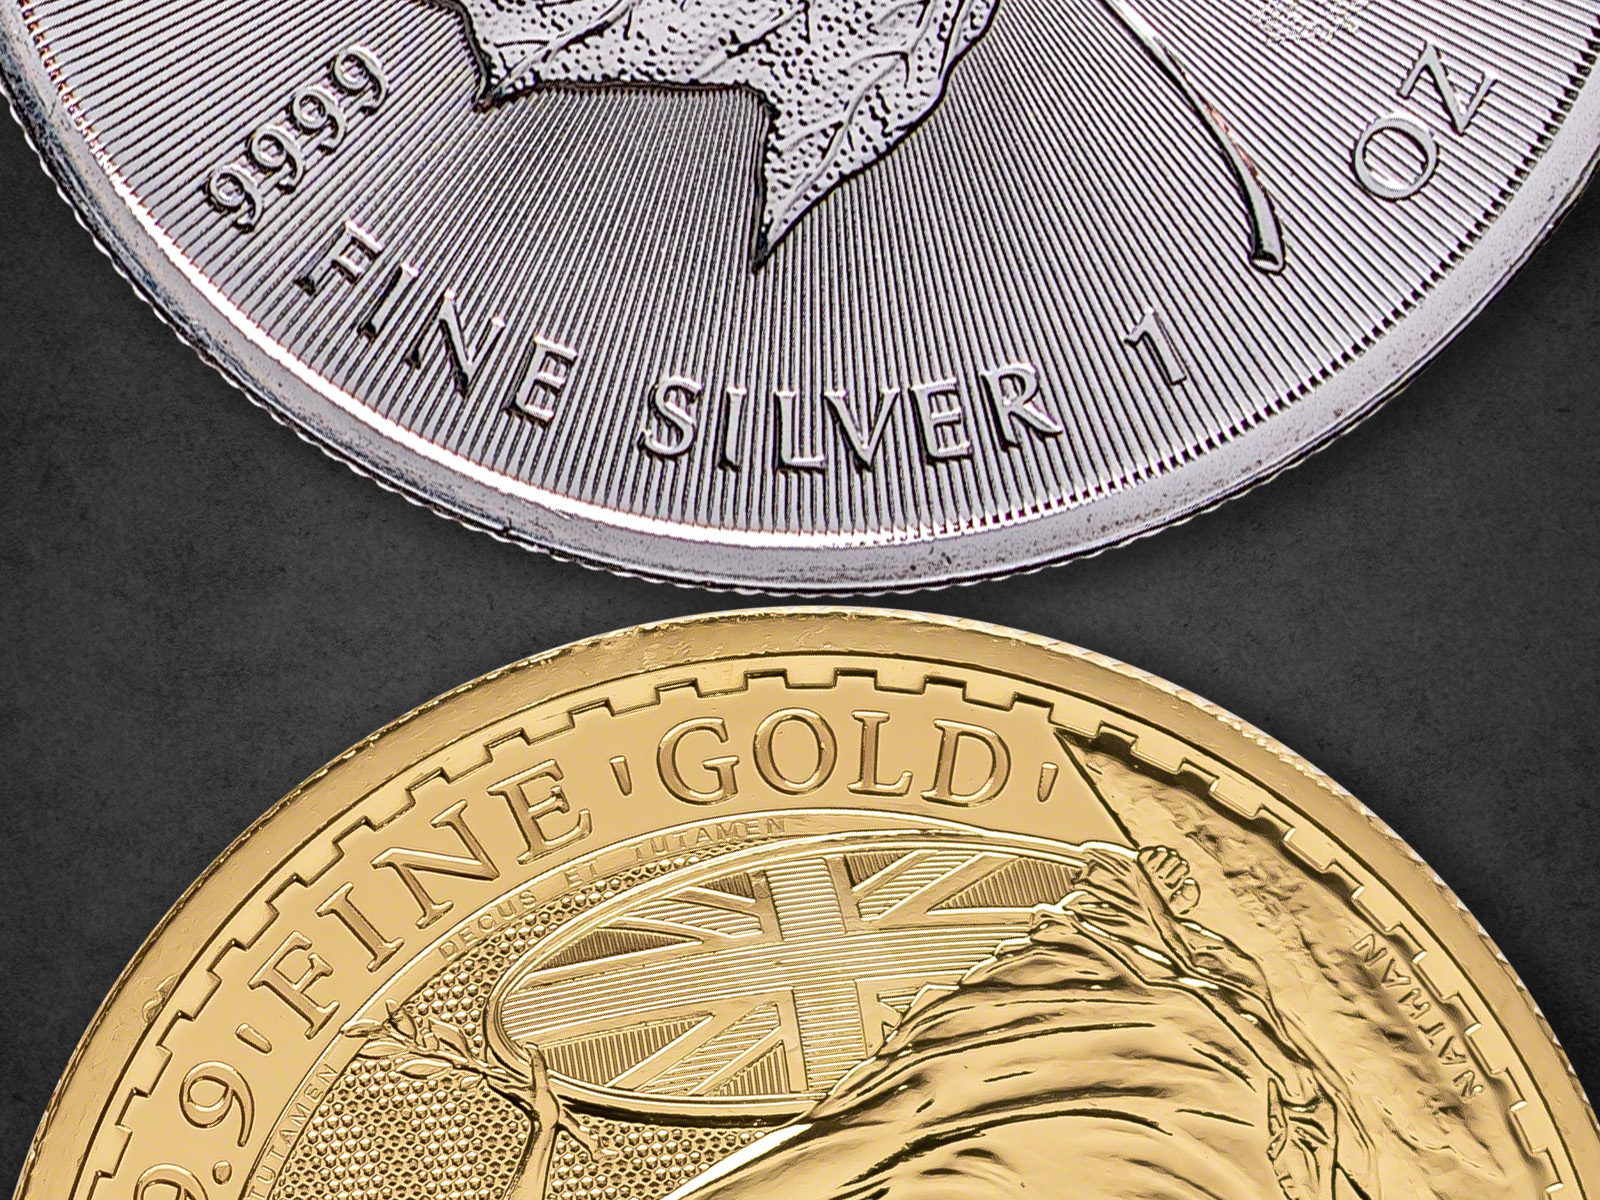
What stands out immediately is how low the ratio was throughout those eras, sitting far below modern levels. Below are some of the key ratios across history.
| Year | Ratio | Period |
|---|---|---|
| 3200 BCE | 2.5 | King Menes, the first Pharaoh of Ancient Egypt, set the ratio at 2.5. |
| 210 BCE | 8 | The Roman Republic set the gold silver ratio at 8. |
| 46 BCE | 11.5 | Julius Caesar set the Roman Empire’s ratio at 11.5. |
| 1350 CE | 9.4 | Medieval Europe saw the ratio fall to 9.4, below even Roman levels. |
| 1792 CE | 15 | The US Coinage Act of 1792 fixed the gold silver ratio to 15. |
| 2020 CE | 125 | In April 2020 the gold silver ratio peaked at 125 as markets reacted to the Covid-19 pandemic. |
Gold Silver Ratio History
The average gold silver ratio remained around 9 all the way through to the 18th century. Once gold and silver were decoupled from their monetary roles, however, that average shifted dramatically.
The ratio saw far greater volatility throughout the 20th century, particularly after World War Two and the establishment of the Bretton Woods system, under which the US dollar was fixed to gold at $35 per ounce. The average gold silver ratio throughout the 1900s was around 47; for the 2000s so far, it has averaged around 70.
In 1980 the GSR hit a modern low of just 17, largely driven by the Hunt Brothers’ aggressive silver purchases which sent prices to record levels. It fell again to around 32 in May 2011 as silver climbed to near $48 in the wake of the Financial Crisis. After a decade spent largely in the 70–90 range, silver’s strong performance and its nominal all-time high in January 2026 ($122.88) have pushed the ratio down as low as 45, its lowest territory since 2011, before recovering to average around 59 through to mid-2026.
The Physical Gold Silver Ratio
Beyond price, it’s worth understanding how gold and silver compare in purely physical terms – both in the ground and in annual mine output.
According to the US Geological Survey (USGS), there is approximately 17.5 times more silver than gold in the Earth’s crust, with most estimates placing the geological ratio somewhere between 15:1 and 19:1. In other words, silver is a considerably more abundant metal than gold in nature.

The mining production ratio tells a different story however. In 2024, approximately 820 million ounces of silver were mined globally, compared to around 118 million ounces of gold, a ratio of roughly 7:1. Silver may be far more abundant in the ground, but extracting it at scale is more complex; much of it is produced as a by-product of mining other metals such as copper, lead, and zinc, rather than from dedicated silver mines.
Set against the current price ratio of around 67:1, both the geological and production ratios are considerably lower. This fact is often cited by those who argue silver remains undervalued relative to gold on a fundamental basis.
How to Use the Gold Silver Ratio in Your Investing
For some, the gold silver ratio is simply an interesting way to compare the two metals over time. For others, it offers practical guidance on which metal to buy. The ratio can indicate whether one metal is undervalued relative to the other, and some investors use that signal to inform their decisions.
Using a long-run average as a baseline, significant moves above or below that level can suggest a shift may be overdue. A high ratio – say, well above 70 – could indicate silver is undervalued compared to gold, and may be due a rise. A lower ratio suggests silver has been outperforming, and gold may be the relatively better value.
It’s worth noting, however, that a change in the ratio can come from either metal moving, whether from prices rising, or falling. A low ratio might mean silver is in ‘overbought’ territory and due for a correction, rather than gold being cheap. The ratio reflects relative strength only; it can’t tell you which direction prices will move.
Gold Silver Ratio Trading Strategies
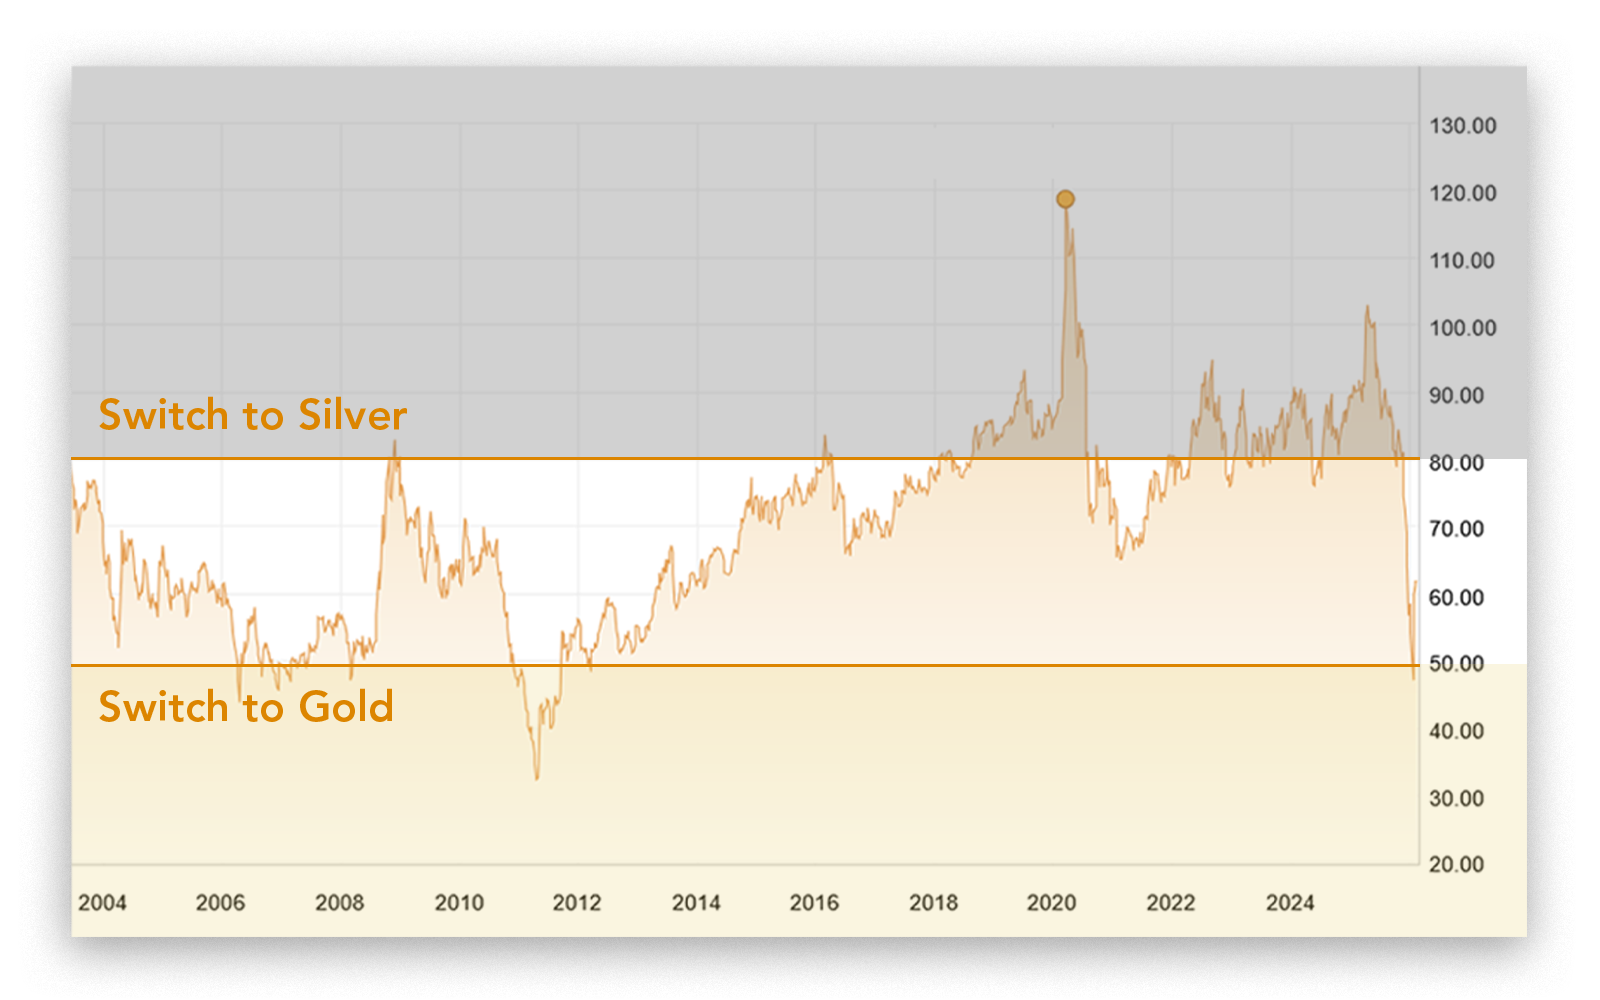
The GSR is used most actively by traders rather than long-term investors, who use it to take positions on which metal may move next. By keeping an eye on a gold silver ratio calculator guides their decision on when to buy silver vs gold. The two most common approaches investors take are:
● Buy silver when the ratio is high (silver is relatively cheap vs gold), and switch to buy gold when the ratio is low.
● Maintain a balanced allocation, holding ounces of silver and gold proportional to the current ratio.
Gold silver ratio trading carries real risk though; the ratio can swing sharply during periods of market volatility, and averages shift over time as market conditions change. Basing decisions on an outdated average could quickly result in a loss.
Anyone using the gold silver ratio is best served doing so alongside a broader view of the market, rather than relying on it as a standalone signal.
Frequently Asked Questions
How to calculate gold silver ratio?
To calculate the gold silver ratio, simply divide the current gold price by the current silver price. Make sure you’re using the same unit of measurement (troy ounces, grams, etc.) for each metal, and the same currency, to ensure you get the correct figure.
Is silver undervalued at the current ratio?
It depends on your benchmark. At around 67, the current gold silver ratio sits around the 10-year average of roughly 70. Measured against the 20th century average of around 47, however, silver could still be considered undervalued on a longer historical view.
What’s a typical gold silver ratio range?
Over the past 10 years, the ratio has typically ranged between 70 and 90, with the notable exception of the spike to 125 during the Covid-19 pandemic in 2020. The average across the 2000s is around 70, while the 1900s averaged around 47. In 2026 so far, the ratio has ranged between approximately 55 and 70, reflecting silver’s strong recent performance.
Should I rebalance based on the ratio?
The ratio can be a useful indicator of which metal is performing well relative to the other, but rebalancing solely on this basis is not normally advised, particularly in the short term. If you can identify a longer-term trend in the ratio, that could be a worthwhile data point to factor into your portfolio decisions.
How often should I check the ratio?
The ratio is a fairly stable measure of the relative value of gold and silver and doesn’t normally fluctuate significantly in the short term. For most investors, checking quarterly or every six months is sufficient. During periods of high price volatility, however, more frequent monitoring may help guide any buying or selling decisions.
What is a good gold silver ratio to buy silver?
There is no universally “good" level, but many investors treat a ratio above 80 as a signal that silver may be undervalued relative to gold and worth buying. Using the modern average of around 70 as a baseline, any significant move above that level is often seen as a buying opportunity for silver, though this should always be considered alongside broader market conditions.
What the Gold Silver Ratio Means for Investors
The gold silver ratio is a simple but revealing tool, one that puts the relationship between gold and silver in historical context and can help inform decisions about which metal offers better relative value at any given time. While we’d caution against relying on it as a standalone signal, used alongside a broader view of the market it can be a valuable addition to any precious metals investor’s toolkit.
With silver’s recent rally pushing the ratio to its lowest levels since 2011, it’s an especially interesting time to keep an eye on how the two metals perform relative to each other in the months ahead.
If you’re ready to take the next step, BullionStar offers physical gold and silver bullion, available for collection from our Bullion Showroom, international shipping, or secure storage. If you have any further questions, please reach out to our friendly team at support@bullionstar.com and we will be happy to assist.
Popular Blog Posts by Gold & Silver 101
 An Introduction to Gold & Silver Investing
 Should I Invest in Gold, Silver, or Platinum Bullion?
 Gold Coins vs Gold Bars: Which Is Better?
 How Is Gold Taxed in Singapore? The IPM GST Exemption Explained
 Storing Precious Metals, Gold, and Silver Bullion
 Gold & Silver Bullion Investing FAQs
 Karat vs Carat: What’s the Difference?
 Gold Purity: The Complete Guide
 How Much Gold Is There in the World?
 Junk Silver: What It Is and What It’s Worth